
When incorporated into a diversified portfolio, private infrastructure has the potential to improve returns, lower volatility, increase return consistency, provide downside risk management, bolster inflation resilience, and generate income for investors.
Stronger Returns and Lower Volatility
Private infrastructure historically exhibits stronger performance with lower volatility than stocks.
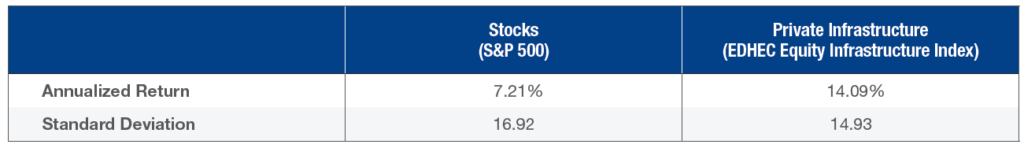
Performance and standard deviation calculated using quarterly returns of the S&P 500 Total Return index (Stocks) and the EDHEC Infrastructure Index (Private Infrastructure) since the first complete quarter of the common inception of both indexes (6/30/2000) through 12/31/2023. Based on data sourced from Scientific Infra and Private Assets (indices. scientificinfra.com). Copyright ©2023 Scientific Infra. All rights reserved.
Return Consistency
Private infrastructure historically exhibits low correlation to other core U.S. asset classes, including stocks, bonds, and private real estate. Investments with low levels of correlation, when utilized together as a part of a diversified portfolio, may exhibit complementary return patterns and improve return consistency.
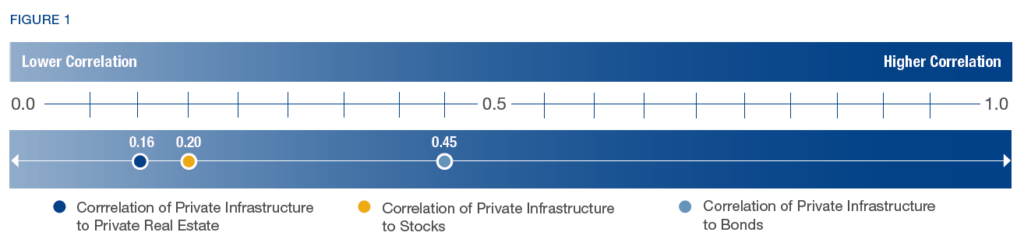
Correlation statistics are calculated using quarterly returns of the S&P 500 Total Return Index (Stocks), the Bloomberg US Aggregate Bond Index (Bonds), and the NCREIFProperty Index (Private Real Estate) vs. the EDHEC Equity Infrastructure Index (Private Infrastructure) since the first complete quarter of the common inception of all indexes(6/30/2000) through 12/31/2023. Based on data sourced from Scientific Infra and Private Assets (indices.scientificinfra.com) Copyright © 2023 Scientific Infra. All rights reserved.
Downside Risk Management
Private infrastructure historically exhibits shorter periods of performance drawdowns when compared to other asset classes like U.S. stocks, bonds, and private real estate. For example, the “Months Spent in Max Drawdown” – or the maximum number of months each asset class declined from peak to trough – lasts 19 months for private real estate, 16 months for stocks, 15 months for bonds, but only six months for private infrastructure. Private real estate, stocks, bonds, and private infrastructure have varying levels of liquidity, which can also affect drawdown.
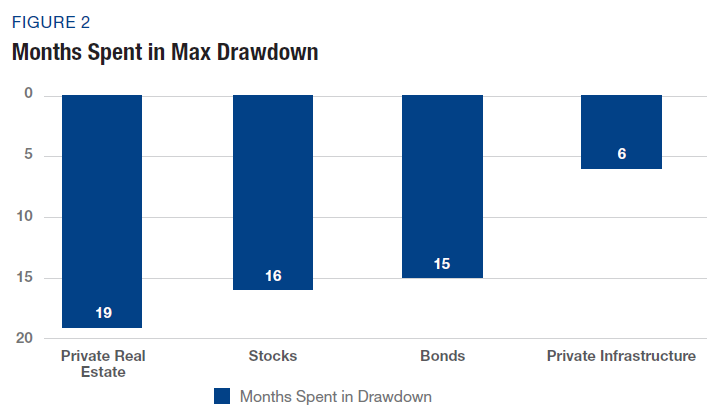
Months spent in max drawdown are calculated using monthly returns of the S&P 500 Total Return Index (Stocks), the Bloomberg US Aggregate Bond Index (Bonds), the NCREID Property Index (Private Real Estate), and the EDHEC Equity Infrastructure Index (Private Infrastructure) since the first complete month of the common inception of all indexes (6/30/2000) through 12/31/2023. Stocks, Bonds and Private Real Estate data are sourced from Morningstar. EDHEC Equity Infrastructure data are based on data sourced from Scientific Infra and Private Assets (indices.scientificinfra.com) Copyright © 2023 Scientific Infra. All rights reserved.
Inflation Resilience
Stocks, bonds, and private real estate historically exhibit different performance patterns when inflation is below vs. above the 2% target set by the U.S. Federal Reserve. Conversely, private infrastructure historically exhibits similar performance patterns across different inflationary periods.
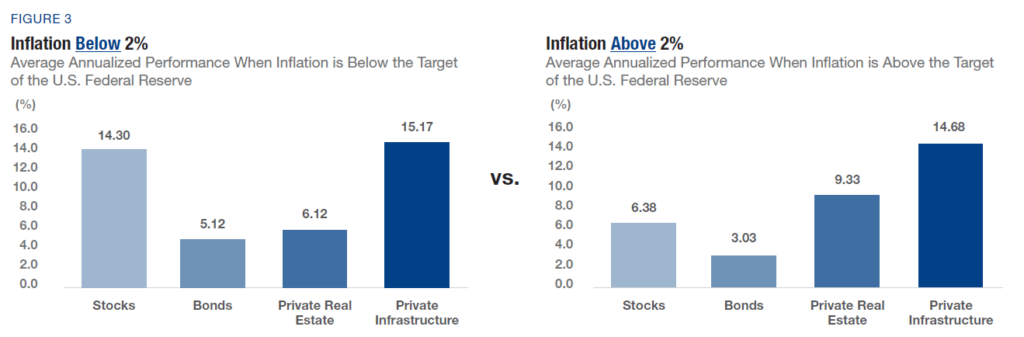
“Inflation Less than 2%” calculated by averaging the annual returns of the EDHEC Equity Infrastructure Index (Private Infrastructure), the S&P 500 Total Return Index (Stocks), the Bloomberg US Aggregate Bond Index (Bonds), and the NCREIF Property Index (Private Real Estate) when the annual change in the US Consumer Price Index was less than 2% since the first complete calendar year of the inception of the index, 2001, through 2023. Annual returns for Stocks, Bonds and Private Real Estate sourced from Morningstar. Inflation sourced from the Bureau of Labor Statistics and YCharts. “Inflation Greater than 2%” calculated by averaging the annual returns of the EDHEC Equity Infrastructure Index (Private Infrastructure), the S&P 500 Total Return Index (Stocks), the Bloomberg US Aggregate Bond Index (Bonds), and the NCREIF Property Index (Private Real Estate) when the annual change in the US Consumer Price Index was greater than 2% since the first complete calendar year of the inception of the index, 2001, through 2023. Annual returns for Stocks, Bonds and Private Real Estate sourced from Morningstar. Inflation sourced from the Bureau of Labor Statistics and YCharts. EDHEC Equity Infrastructure Index is based on data sourced from Scientific Infra and Private Assets (indices.scientificinfra.com) Copyright © 2023 Scientific Infra. All rights reserved.
Historically Consistent and Reliable Income
Private infrastructure historically exhibits consistent, tax-efficient income due to the distinctive characteristics of the asset class.
- Essential Services Society relies upon the essential products and services provided by infrastructure assets. As a result, demand is less sensitive to economic downturns.
- Long Asset Life Private infrastructure assets, contracts, and concessions are typically long-term, resulting in stable and predictable cash flows.
- High Barriers to Entry Substantial capital investments, regional advantages, and regulatory approvals often create high barriers to entry for infrastructure projects, leading to near-monopolistic market positions.
- Potential Tax Benefits Specific infrastructure investments may be eligible for energy infrastructure credits, such as Investment Tax Credits and Production Tax Credits, as well as accelerated depreciation, which may help support free cash flow and after-tax income for investors.
Private Infrastructure Summary
Potential Portfolio Construction Benefits
- Increase Returns and Lower Volatility
- Improve Return Consistency
- Provide Downside Risk Management
- Bolster Inflation Resilience
- Generate Income for Investors
This material is not an offer or a solicitation related to any securities or other investment product. The analysis contained in this publication does not constitute a personal recommendation or take into account particular investment objective, investment strategies, financial situation and needs of any specific recipient and does not constitute tax, legal, or accounting advice. Cantor Fitzgerald & Co., an affiliate of Cantor Fitzgerald, L.P. (together with its affiliates and subsidiaries, “Cantor Fitzgerald”), recommends that you obtain independent financial and/or tax advice as to the implications of investing in the manner described or in any of the products mentioned herein. Certain services and products are subject to legal restrictions and cannot be offered worldwide on an unrestricted basis and/or may not be eligible for sale to all investors. Some of the information and opinions expressed in this document were obtained from third-party sources that are believed to be reliable and made in good faith, but no representation or warranty, expressed or implied, is made as to the accuracy or completeness thereof. All opinion and information indicated are current only as of the date of this report and are subject to change without notice. Opinions expressed herein may differ or be contrary to those expressed by other business areas or divisions of Cantor Fitzgerald or its affiliates as a result of using different assumptions and or criteria. The contents of this document have not been, and will not be approved by any securities or investment authority in the United States or elsewhere. Cantor Fitzgerald and its affiliates disclaim all liability for any loss that may arise from use of the information herein. References herein to past returns of any fund, investment product or market sector are no indication or future performance.