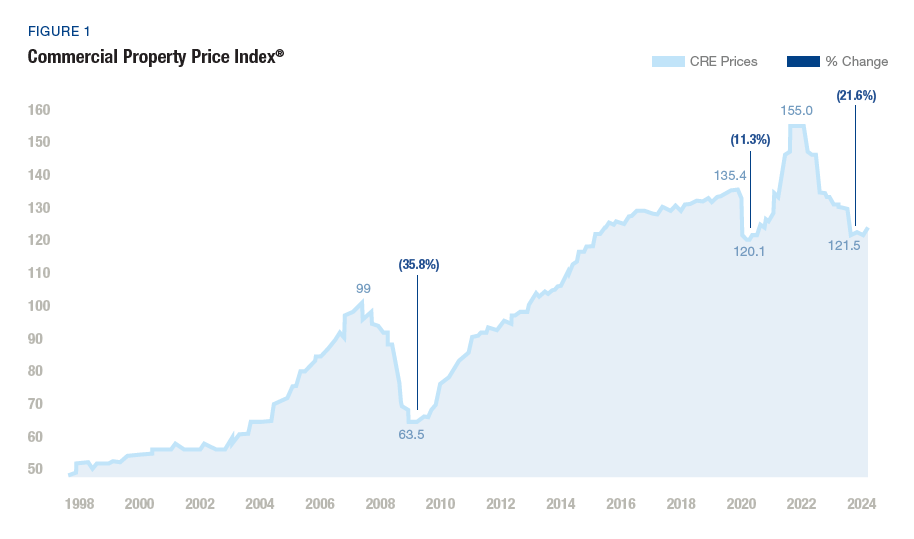
Economic conditions have battered Commercial Real Estate (CRE) prices over the last two years since reaching their peak in April-May 2022. Green Street Commercial Property Price Index® (CPPI) data shows as much as a 21.6% drop during that period.
However, since reaching a bottom in January 2024, CPPI movement has trended slightly upward, which, alongside other leading indicators, suggests that the CRE market is at or near its bottom for the current economic cycle.
These conditions highlight the strategic opportunity of entering the CRE market through vehicles with high-quality assets, balance sheet integrity, and appropriate valuations. The second half of 2024 may be the beginning of an attractive entry point for core and core-plus allocations.

Source: Green Street Commercial Property Price Index®. July 2024.
The Current State of the CRE Market
Inflationary pressures and interest rate hikes have played a large part in driving CRE price declines. Social changes such as hybrid work and relocation have added to the turbulence for specific markets, asset types, and certain individual properties.
However, data since January 2024 may indicate that the CRE market correction is leveling.

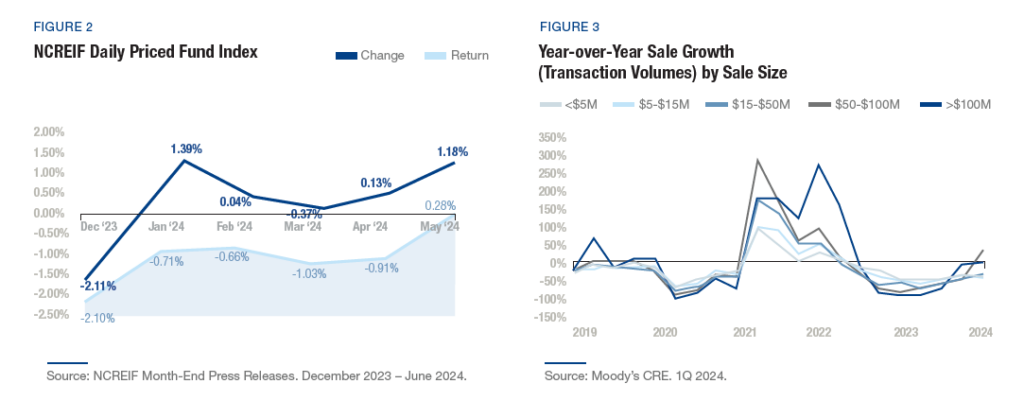
In May 2024, the National Council of Real Estate Investment Fiduciaries (NCREIF) Daily Priced Fund Index Data saw its first positive monthly return since the beginning of the year on the back of improving month-to-month conditions—73% of industrial markets and 58% of retail markets generated positive and rising total returns in 1Q 2024. (See Figure 2)
Increased transaction volumes indicate a growing confidence among investors and a potential stabilization in property prices. Moreover, the market’s liquidity for transactions between $50 million and $100 million have significantly increased, signaling sustained investor interest and activity. (See Figure 3)
Publicly traded U.S. REITs have historically been a leading indicator for private market pricing and recently have shown signs of recovery. (See Figure 4)
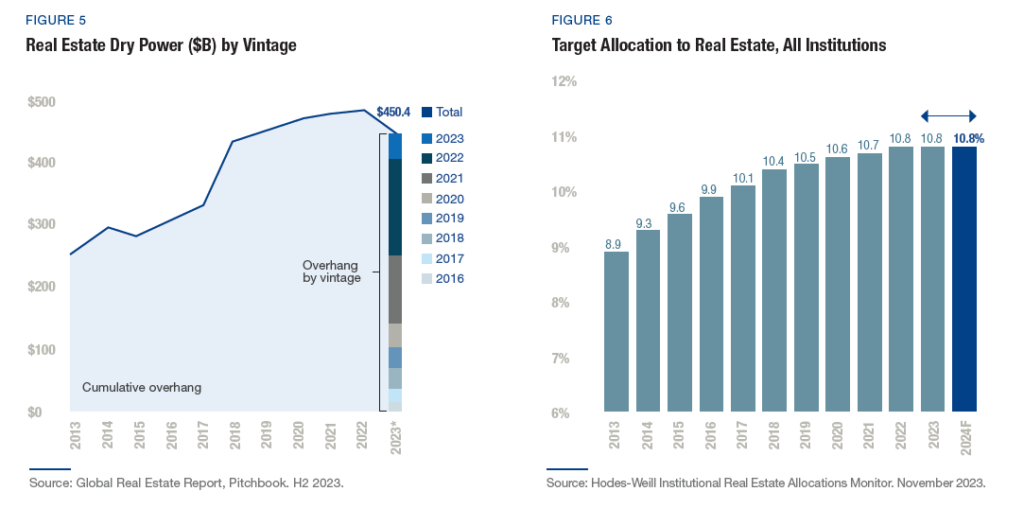
Institutional investors have not backed off on CRE allocations, which remained at 10.8% in 2022 and 2023 and are expected to continue at that level in 2024. (See Figure 6)

Dry powder for private real estate investments equates to a leveraged purchasing power of $475 billion as of April 2024 (per PitchBook data, based on a 55% loan-to-value ratio), suggesting pent-up demand and potential pricing support. (See Figure 5)

The combination of increased transaction volumes, stabilizing asset valuations, expectations for interest rate cuts from the Fed, and emerging positive sentiment within the industry provide reasons for optimism that the CRE market is poised for a recovery.
Under such conditions, investors can capitalize by targeting fundamentally sound assets with strong balance sheets and realistic valuations to be ready for the market transition out of its correction phase. On the upside, strategic investments during this period may yield substantial returns as the CRE market regains momentum.
Although some investors may be tempted to wait until seeing the exact bottom of the market, doing so is difficult. Instead, recent data as seen in Figure 7 on the right shows that CRE properties can be acquired at attractive valuations and a healthy spread of 190 basis points to 10-year Treasury yields. This is the first time in over a decade we have seen transaction cap rates exceed 6%. The key for long-term investors is to recognize attractive relative valuations. This approach minimizes the risk associated with market timing while maximizing the potential for long-term outperformance.

Means of Entry: Vehicles and Due Diligence
Not all CRE assets are created equal, however, so due diligence is paramount. While some news headlines about individual property sector stress, such as multi-tenant office buildings, might distort perceptions, investors looking for an entry point can find well-constructed vehicles focusing on asset, sector, and geographic quality with appropriate valuations.
Asset Quality
Investors should look to vehicles with attractively valued assets that reflect the impact of recent market conditions but possess strong fundamentals. These assets are likely to outperform as the market recovers. Emphasis should also be placed on properties with resilient traits, such as fully occupied buildings with long-term net leases to strong credit tenants delivering stable Net Operating Income (NOI).
Sector Positioning
Certain regions and sectors are expected to outperform others in the recovery phase. For instance, in the multifamily sector, the cost of purchasing a home relative to renting an apartment has never been more expensive, resulting in a larger and longer-term renter pool. In addition, in some markets, primarily in the Sun Belt, we expect a housing shortage to lead to significant increases in NOI, yielding attractive returns to patient investors. Identifying these macroeconomic conditions can yield higher returns than more volatile sectors.
Balance Sheet Analysis
Investors should prioritize funds with strong balance sheets, moderate leverage, and long-term fixed-rate debt to insulate against poorly timed maturities. This financial stability helps funds weather the current challenging CRE lending environment, brought on by higher interest rates and more restrictive bank lending, in order to capitalize on the recovery and growth phases of the cycle.
Valuation
Assessing the valuations of existing real estate funds is critical. Investors should ensure the funds are priced according to current market conditions rather than outdated valuations. Valuations from 2022 and early 2023 will not reflect the realities of today’s market. Proper due diligence helps to avoid overpayment and maximize upside by ensuring that one’s entry point reflects current market value.
CRE in Portfolio Construction
Provided investors conduct rigorous due diligence, CRE remains a compelling strategic investment in a balanced portfolio despite the current choppy economic climate. The market resilience of CRE, particularly in sectors like multifamily, net lease, and industrial, supports stable cash flows even during economic downturns.
Factors such as demographic trends, remote and hybrid working conditions, the historic relative affordability of renting versus owning a home, and the increasing demand for specialized property types such as warehouses, logistics, and data centers make it a robust addition to any diversified investment portfolio. Post-COVID macro conditions, which have adversely impacted the multi-tenant office sub-sector, do not negate the overall strengths of the CRE asset class overall, which is much broader than office.
In addition, CRE provides several structural advantages. It offers an effective inflation hedge as rents and replacement costs often increase with inflation, protecting purchasing power. Moreover, CRE offers significant diversification benefits, reducing portfolio volatility by providing exposure to a lesscorrelated asset class. Finally, CRE investments typically generate highly taxefficient income through depreciation and other tax advantages, enhancing after-tax returns.
Vehicle Structures
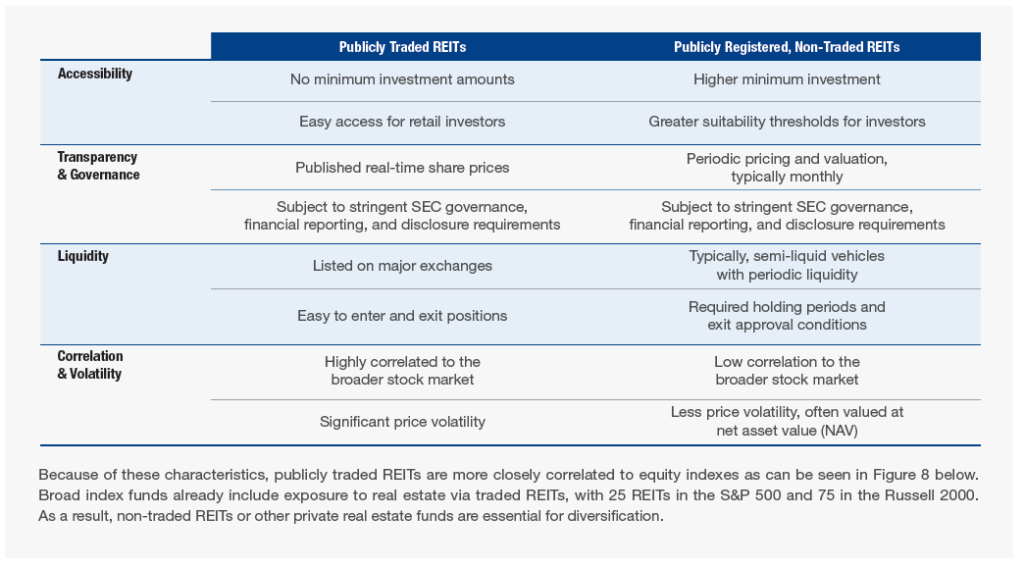
Real Estate Investment Trusts (REITs) provide a straightforward path for accessing CRE. However, REITs come in different structures. Publicly traded REITs and publicly registered non-traded REITs, two types of REITs, have different characteristics that are important to consider.


By leveraging multiple investment structures and conducting diligent analysis, investors can effectively navigate the current economic climate and capitalize on CRE’s historically attractive return attributes with an attractive entry point for long-term value creation.
Takeaways
CRE presents a strategic opportunity for long-term-minded investors. Waiting for a bottom is challenging and may ultimately lead to disappointment.
With its potential advantages, such as acting as an inflation hedge, providing diversification benefits, generating tax-efficient income, and demonstrating market resilience, CRE commands an important role in portfolio construction. Real Estate Investment Trusts (REITs) offer an accessible pathway to CRE, with publicly traded REITs providing enhanced liquidity accompanied by higher volatility and stock market correlation. By contrast, publicly registered non-traded REITs, while not daily liquid, offer the potential for increased stability, lower correlations, and diversification.
This commentary has been prepared by Cantor Fitzgerald Asset Management (CFAM) for use with investors and financial advisors who are each expected to make their own investment decisions.
Nothing contained herein should be treated as investment advice or a recommendation to buy or sell any security. The information contained herein is for educational and informational purposes only.
Nothing herein shall constitute tax advice and as such, investors should be advised to consult their own tax adviser regarding the tax consequences of their investment activities.
This commentary discusses general market activity, industry, sector trends, or other broad-based economic, market or political conditions and should not be thought of as research or investment advice. This material has been prepared by CFAM and is not a research product and was not produced by Cantor Fitzgerald & Co. The views and opinions expressed may differ from those of Cantor Fitzgerald and its affiliates.
Certain economic and market information contained herein has been obtained from published sources and/or prepared by third parties. While such sources are believed to be reliable, neither CFAM nor its parent or any affiliates, employees or representatives assumes any responsibility for the accuracy of such information. Market indices are included only to provide an overview of wider financial markets and should not be viewed as benchmarks or direct comparable performance to CFAM portfolios. It is not possible to invest directly in an index.
The information in this presentation is subject to change without notice and we have no obligation to update you as to any such changes. We do not undertake any obligation to update or revise any statements contained herein or correct inaccuracies whether as a result of new information, future events or otherwise.
Past performance or targeted results is no guarantee of future results, and an investment may lose money. Performance when shown is net of investment advisory fees and other expenses and assumes the reinvestment of all capital gain distributions, interest and dividends. Investors should consider the investment objectives, risks, charges and expenses of the investment strategy before investing.
